Checking the effect
To watch the effect and performance of the Merus Ring in industrial applications there are different possibilities.
Depending on the problem different performance indicators can be used for a before and after comparison. Like the temperature difference or pressure difference. With this data you can decide the further procedure after the trial phase or for long-term monitoring.
If you are interested in performance monitoring for your project, please note this in your request.


Comparing flow rates
In many cases a performance monitoring is already installed. That makes it easy to compare the data before and after the installation or a treated and an untreated system. Which method is used to get the data depends on the customer and the access to the data. If you recorded for example the flow rate in the past this would be an easy way to measure the influence of the Merus Ring in your system.
To compare values either the data of the previous period or those of a structurally identical pipe is needed.
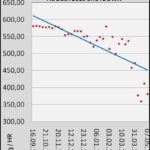
In the graph you can see the values of two similar systems in one company. Both systems get the same water and the same problems with fouling occured. The trend line in the first graph shows a decreasing flow rate. The reason for this is the reduced pipe diameter due to deposits at the walls of the pipe.
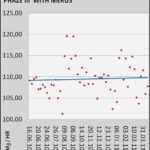
The second graph shows a stabilized development with slightly increasing flow rate.
Monitoring Energy Consumption

The energy consumption can be an indicator for the effect of the Merus Ring because it indicates the efficiency of a system. This can be important in case of heat exchangers but also other applications. Just as for the flow rate a comparison of the data before and after the installation is necessary to interpret the values.
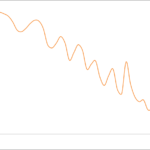
In the table two heating circuits are compared. One is treated by Merus and one is left in original condition. The data is recorded for seven months before and after the installation. The untreated heating circuit shows a reduced efficiency whereas the treated heating circuit shows even an improved efficiency.
In this case the gas savings have been more than 30,000 m3
Calcium or total Iron in the Water in a closed Loop

Doing a water analysis is a very easy and efficient way of checking what is going on the water system. If possible, we use this method as an indicator for the developments in the system after the installation. In closed cooling loops these values give a reliable indication of the process in the water. In huge, open systems the data is more complex and needs to be analyzed more carefully. Compared with the total volume in the loop the changes in the calcium or iron amount can be minimal in this case - but are visible.
The chart shows the values of a closed loop. The values without Merus have been recorded prior to installation and eight weeks afterward. In these weeks no fresh water was added. The increasing values are desired - they indicate that existing deposits have been solved in the water and are flushed out of the system.
Volumetric Measurement - Measuring the inner Volume of a Heat Exchanger
There are so called welded heat exchangers. These can't be opened for cleaning or servicing. Normally these are rather small heat exchangers.
In these cases we measure the (actual) 
The table shows that on the primary input the original volume could be re-established. The measurement has been taken two weeks after the installation. On the secondary side the usable volume increased significantly.
TDS - Total Dissolved Solids - in an open Water Loop
If the fouling and deposits in the system are advanced it can be difficult to get reliable data for the monitoring. One solution can be the long-term surveillance of the TDS (amount of substances which are dissolved in the water). Directly after the installation of the Merus Ring this value will increase significantly.
The reason for this is that encrusted deposits are solved in the water and flushed out. Over time this value decreases until it reaches the level of the feed water and stabilizes.

Visual Inspection

Often it is not possible to open the system or pipes easily. In this case we install the Merus Ring when a regular, short-term down time of the system.

